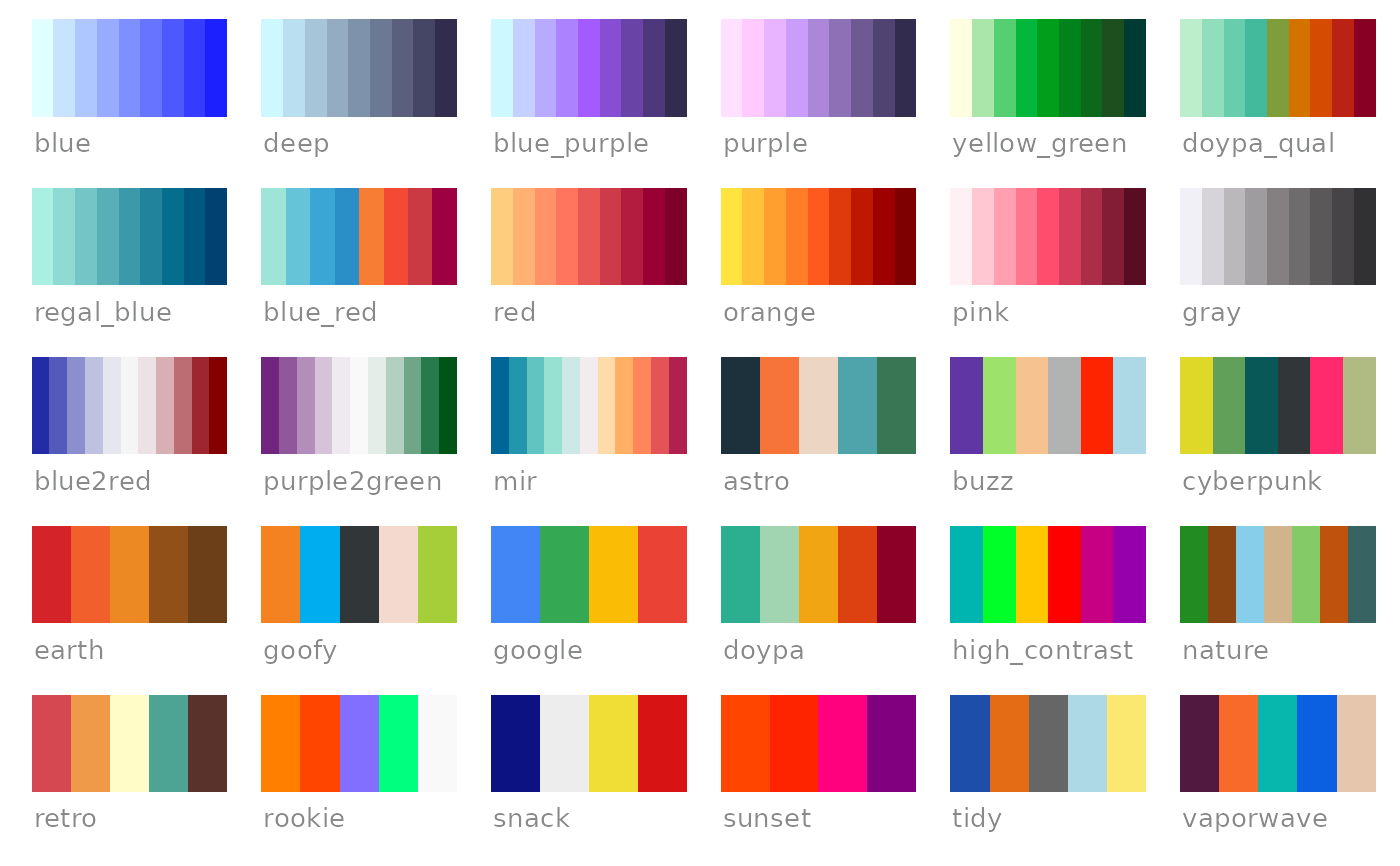
This function generates a visual preview of DOYPAColors color palettes. It helps users explore and select color schemes for their data visualizations by displaying each palette in a grid format.
Usage
preview_doypa_pals(type = "all", colorblind = FALSE)
Arguments
- type
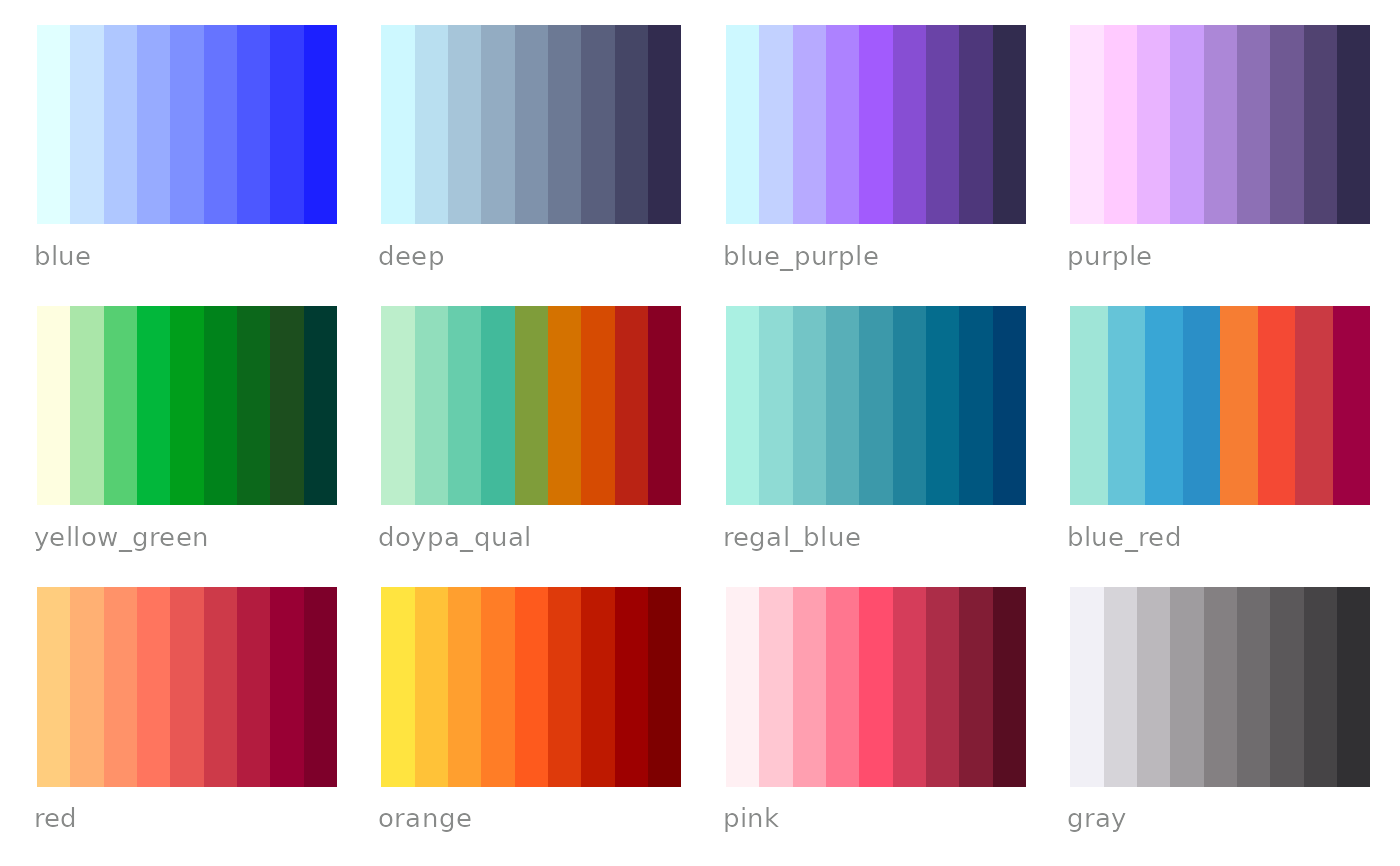
Character string specifying the type of palettes to preview. Options are: "all" (default), "seq" (sequential), "div" (diverging), or "qual" (qualitative).
- colorblind
Logical. If `TRUE`, restricts the preview to palettes designed with colorblind individuals in mind.
Value
A `ggplot` visualization displaying the DOYPAColors color palettes, facilitating exploration and selection of color schemes for data visualizations.
Examples
# Preview all available DOYPAColors palettes
preview_doypa_pals()
 # Preview only sequential DOYPAColors palettes
preview_doypa_pals(type = "seq")
# Preview only sequential DOYPAColors palettes
preview_doypa_pals(type = "seq")
 # Preview colorblind-friendly DOYPAColors palettes
preview_doypa_pals(colorblind = TRUE)
# Preview colorblind-friendly DOYPAColors palettes
preview_doypa_pals(colorblind = TRUE)