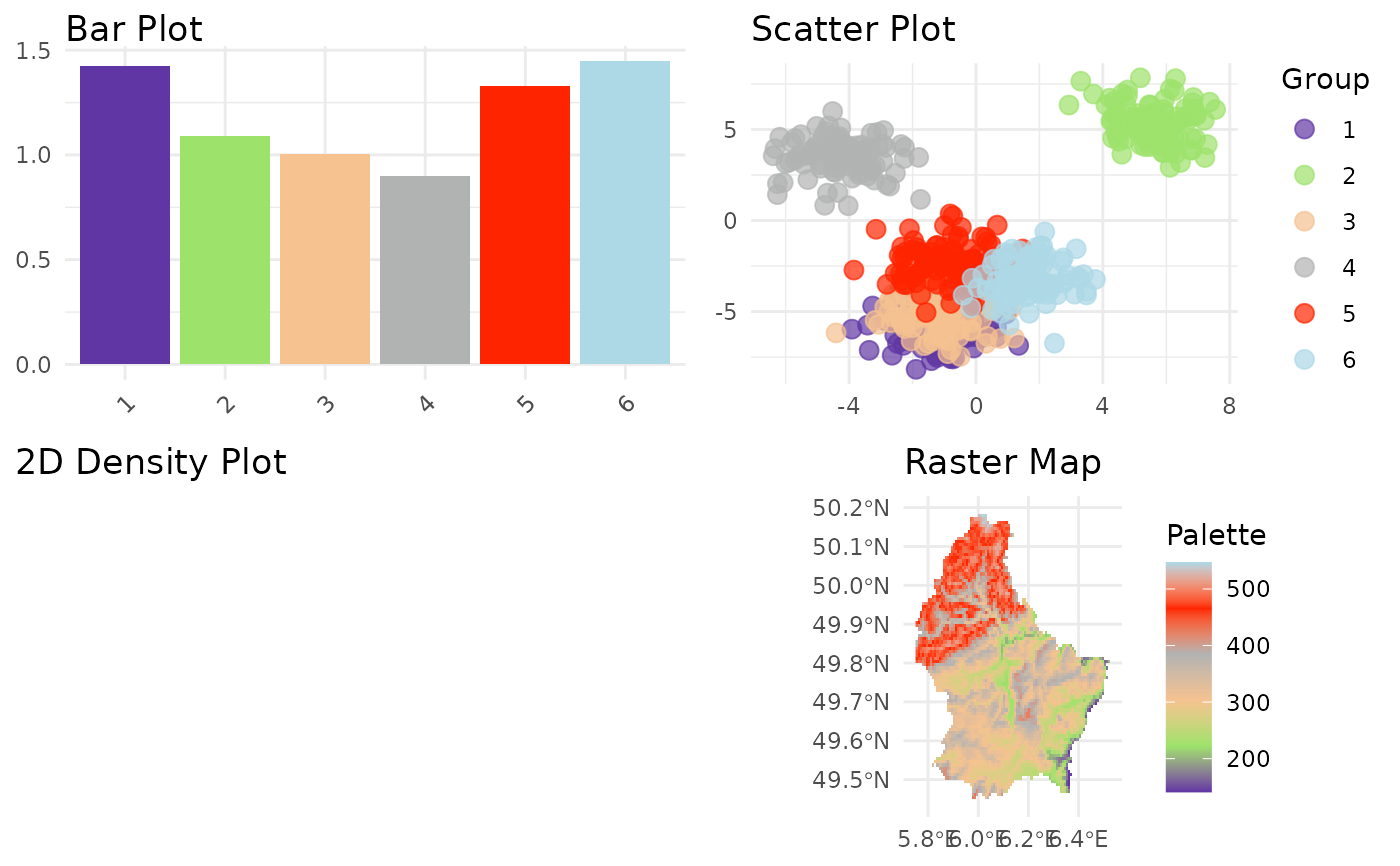
This function generates a visual preview of a DOYPAColors palette with multiple plots. It includes a direct palette preview, a scatter plot, a bar plot, and a heatmap, each using the specified palette.
This function generates a visual preview of a DOYPAColors palette with multiple plots. It includes a direct palette preview, a scatter plot, a bar plot, and a heatmap, each using the specified palette.