This function sets the fill scale for ggplot2 using DOYPAColors color palettes, allowing you to use these palettes in your ggplot2 visualizations for both discrete and continuous data.
Usage
scale_fill_doypa(
  palette = NULL,
  n = NULL,
  reverse = FALSE,
  gradient = FALSE,
  discrete = FALSE,
  type = "all",
  colorblind = FALSE,
  ...
)
Arguments
- palette
A character string specifying the name of the palette to use. If `NULL`, a random palette will be selected.
- n
Number of colors needed. If `NULL`, it will default to the number of levels for discrete scales or to a continuous gradient for continuous scales.
- reverse
A logical value indicating whether to reverse the order of colors in the palette. Default is `FALSE`.
- gradient
A logical value indicating whether to interpolate colors as a gradient of `n` colors between the first and last colors of the palette. If `FALSE`, returns the first `n` colors of the palette.
- discrete
Boolean indicating whether to generate a discrete or continuous palette (default: continuous).
- type
A character string specifying the type of palettes to select from: "all", "seq" (sequential), "div" (diverging), or "qual" (qualitative). Default is "all".
- colorblind
A logical value indicating whether to restrict the palette to colorblind-friendly options. Default is `FALSE`.
- ...
Additional parameters passed to ggplot2's `scale_fill_*` functions.
Examples
library(ggplot2)
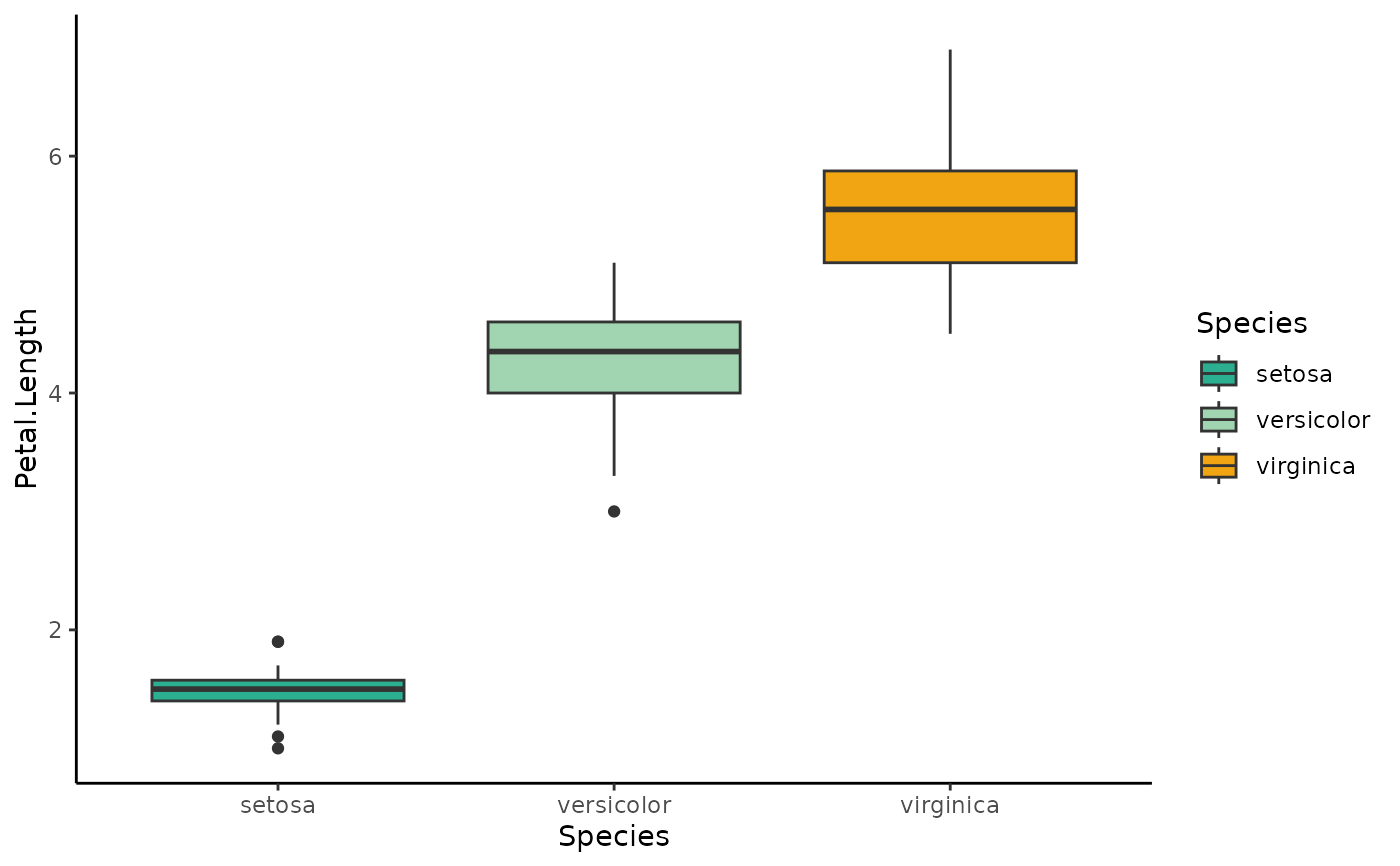
# Discrete data
data(iris)
disc <- ggplot(iris, aes(x = Species, y = Petal.Length, fill = Species)) +
geom_boxplot() + theme_classic()
disc <- disc + scale_fill_doypa(palette = "buzz", discrete = TRUE)
print(disc)
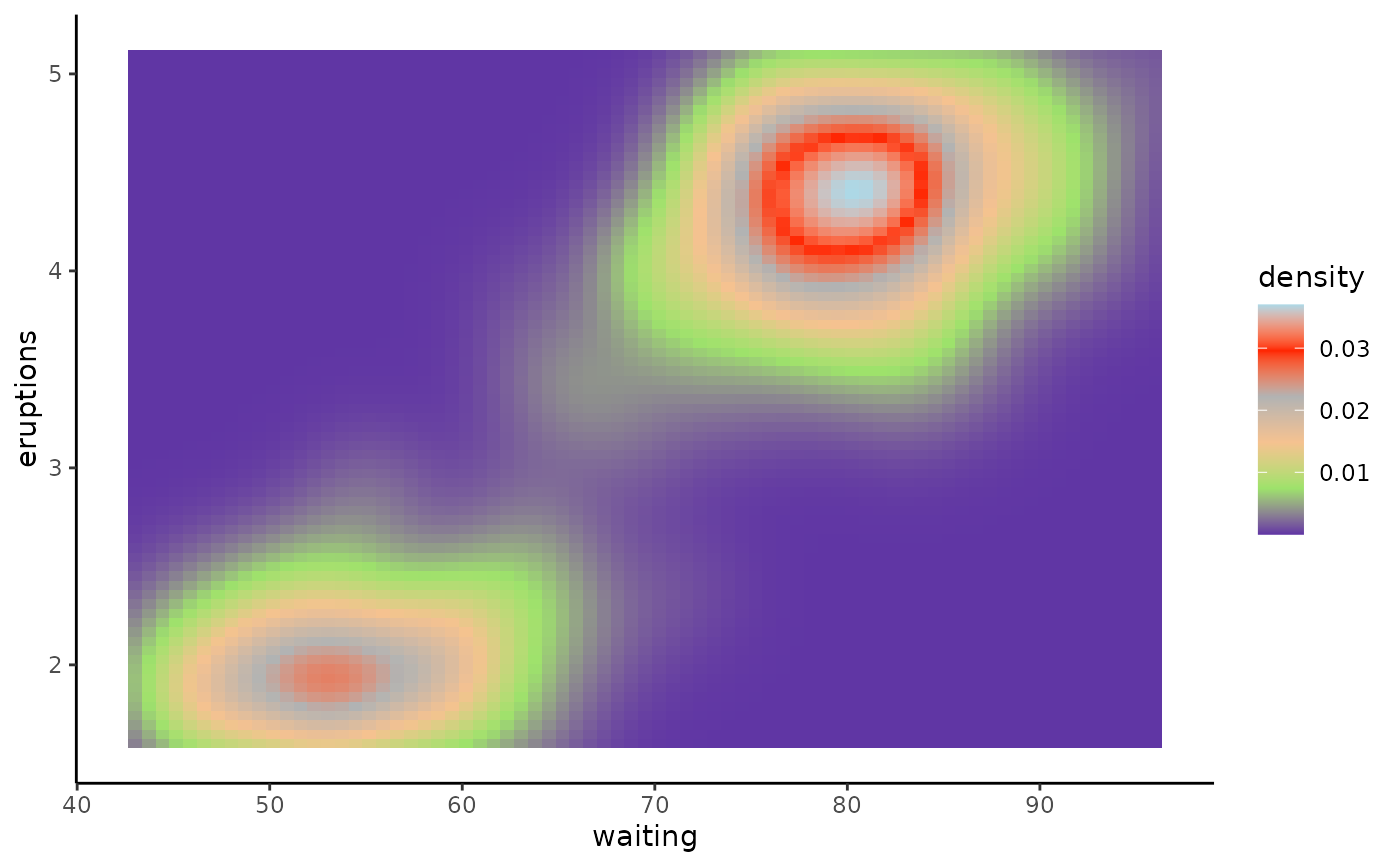
 # Continuous data
cont <- ggplot(faithfuld, aes(waiting, eruptions, fill = density)) +
geom_tile() + theme_classic()
cont <- cont + scale_fill_doypa(palette = "buzz")
print(cont)
# Continuous data
cont <- ggplot(faithfuld, aes(waiting, eruptions, fill = density)) +
geom_tile() + theme_classic()
cont <- cont + scale_fill_doypa(palette = "buzz")
print(cont)
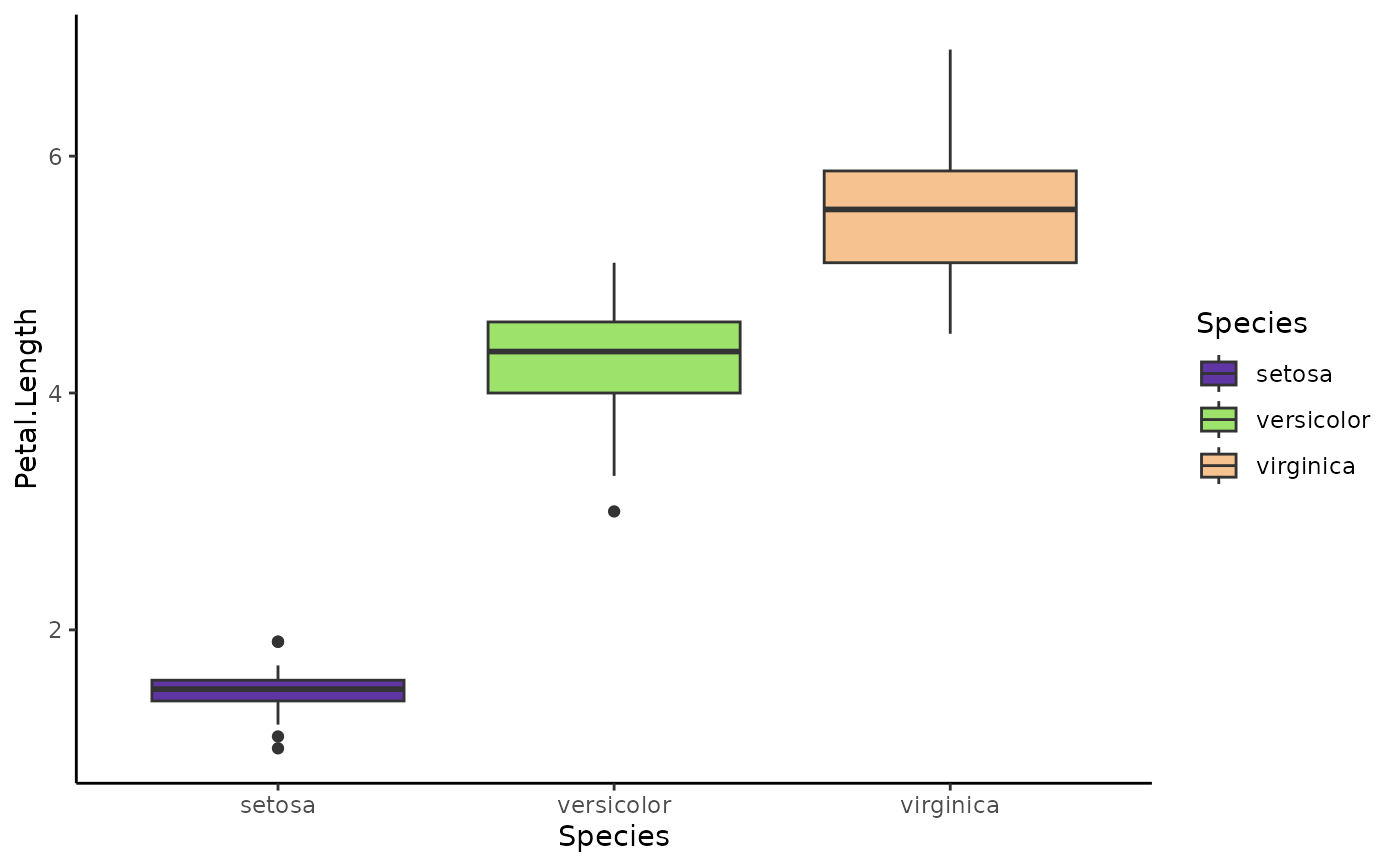
 # Colorblind-friendly palette
disc_colorblind <- ggplot(iris, aes(x = Species, y = Petal.Length, fill = Species)) +
geom_boxplot() + theme_classic()
disc_colorblind <- disc_colorblind + scale_fill_doypa(colorblind = TRUE, discrete = TRUE)
print(disc_colorblind)
#> Look what the palette fairy brought - it's the 'doypa' palette! Now, let's get creative!
# Colorblind-friendly palette
disc_colorblind <- ggplot(iris, aes(x = Species, y = Petal.Length, fill = Species)) +
geom_boxplot() + theme_classic()
disc_colorblind <- disc_colorblind + scale_fill_doypa(colorblind = TRUE, discrete = TRUE)
print(disc_colorblind)
#> Look what the palette fairy brought - it's the 'doypa' palette! Now, let's get creative!